What Makes an Elite Hyrox Athlete?
Since I started training for Hyrox about a year ago, I've been obsessed with the question of what separates me from the elite athletes. What are the specific capabilities that these athletes have that allows them to perform at the highest level in the sport? How much faster are they? How much stronger are they? How much harder can they pull on the ski and row? I suppose I hope that by answering these questions I might one day reach the level these athletes are at.
I think training results give us the most direct answers to these "capability" questions. Its not enough to know that the elite athletes are faster (obviously). Hyrox is interesting because there are so many distinct trainable components (running, strength and power for sleds, muscular endurance for lunges and wallballs, etc.), and I want to know the levels the elite athletes attain in each of these components to perform the way they do. One-rep maximum back squat numbers might give us an indication of just how much raw lower-body strength and power is necessary to perform the sled push at an elite level. The pace at which they run a 10x1k threshold session indicates how high our fitness needs to be to run at an elite pace throughout the race.
Some athletes publish these types of training results via podcasts (like RMR, The Next Move or the Hybrid Coaching Podcast) or YouTube videos (like those from Hunter McIntyre or Beau Wills). But most don't - its not a reliable source of data to characterize the entire elite field.
However, we do have complete and detailed race data for every Hyrox race ever run, and we can use athlete performances in competition as a proxy for their underlying capability. Race results also provide insights that wouldn't be available from isolated performance data, including, for instance, how performance in one component of the race correlates with others or how consistency of effort impacts race outcomes.
In this post, we'll answer the question: based on race results, what are the key performance measures that distinguish elite Hyrox athletes from the top non-elites in the same weight category? We'll analyze a single event, the 2025 World Championships in Chicago, considering both male and female solo divisions.
Dataset Collection
There is a huge volume of Hyrox race data out there, but to my knowledge none of the available repositories expose this data for export in a way that facilitates custom data analysis. For this reason, I wrote a Python client library called pyrox to automate queries against and export of data from hyresult.com.
I executed two distinct "jobs" to export the datasets for this particular analysis, one for the men and one for the women at the 2025 World Championships. For example, the core logic of the script I used to generate the dataset for the men looks like:
client = Hyrox()

loader = MultiDivisionLoader(client)
duration = loader.load(
    "chicago_2025",
    {models.DivisionName.ELITE_MEN, models.DivisionName.PRO_MEN},
    Path.cwd() / "results.csv",
    athlete=True,
    splits=True,
)
Executing this script once for the men and once for the women produces two CSV files, results_men.csv and results_women.csv. The remainder of this analysis assumes the results are available in this tabular, CSV format.
The notebook that implements the analysis described in the rest of this post is available on GitHub. I won't reproduce the entire notebook here, but I will include some code snippets where I think it contributes to the analysis.
Loading the Dataset
We can load the dataset as a dataframe with pandas:
data_path = Path.cwd() / ".." / ".." / "data" / f"results_{GENDER}.csv"
if not data_path.is_file():
    raise ValueError(f"results not found at path {data_path}")

df = pd.read_csv(data_path)
Each row in the dataset represents a result from the World Championships. The row identifies the athlete, their finish position, and their splits for runs, stations, and the roxzone, among other data.
| Column Name | Data Type | Description |
|---|---|---|
event_name |
String | The name of the event from which the result originated |
division_name |
String | The name of the division from which the result originated |
athlete_name |
String | The athlete name as it appears in the results listing |
athlete_canonical_name |
String | The unique athlete identifier maintained by hyresult |
athlete_profile_url |
String | The URL to the athlete's profile |
age_group |
String | The athlete age group for this result |
position |
Integer | The athlete overall finish position |
position_ag |
Integer | The athlete age group finish position |
finish_time |
Integer | The athlete total finish time, in seconds |
analysis_url |
String | The URL for the athlete's result analysis |
has_splits |
Boolean | A boolean indicating whether this result has splits data |
run_X |
Integer | A column for each of the eight runs with the run duration in seconds |
station_X |
Integer | A column for each of the eight stations with the station duration in seconds |
roxzone |
Integer | The athlete's total roxzone time, in seconds |
The data export process enabled by pyrox is solid, but it is still susceptible to transient errors because it relies on web scraping. As a result, some of the rows in the datasets do not have splits data because scraping failed repeatedly for these splits during export. Run and station splits are the primary data in which we're interested, so we exclude these rows from the dataframe.
df = df[df["has_splits"]]
After filtering, the number of results we have for each gender are as follows:
| Elite | Non-Elite | Total | |
|---|---|---|---|
| Men | 14 | 878 | 892 |
| Women | 14 | 718 | 732 |
In addition to filtering out the results without valid splits, I also limit the number of non-elite results against which the elites are compared:
non_elites = df[df["division_name"] == str(DIV_NON)].head(TOP_K)
I repeated this analysis with a variety of threshold values for the number of non-elites we consider and the results remained relatively stable. In this post, I'm reporting results with this TOP_K threshold set to 256.
Handling the Roxzone
Hyrox does not record roxzone splits for elite races. This presents a problem for this comparison because the times for elite athletes are composed only of run and station components whereas times for non-elites consist of runs, stations, and roxzone - we can't directly compare run and station splits between the two races because they don't represent the same amount of work.
For this analysis, I handled this discrepancy by "distributing" the roxzone times for the non-elites evenly across all eight run splits:
allocation = (df["roxzone"] / 8).astype(int)
for i in range(8):
    df[f"run_{i+1}"] = df[f"run_{i+1}"] + allocation
This isn't perfect. Its unlikely that the aggregate roxzone time would be evenly distributed in this way, and it might be more accurate to distribute some of this time to station splits rather than to runs. But I do think this gives us a decent approximation that allows us to proceed with the analysis.
Some Summary Statistics
A useful place to start when comparing the performance of these two groups is summary statistics - how do the mean times for run total, station total, and finish time compare?
For the men's race, the results look like this:
| Run Total | Station Total | Finish Time | |
|---|---|---|---|
| Elite | 30:55 | 25:53 | 56:49 |
| Non-Elite | 34:22 | 29:10 | 63:36 |
| Difference | +3:27 | +3:17 | +6:47 |
For the men, the difference in mean finish time is almost evenly distributed between runs and stations - the elites do not dominate the non-elites in either of the two race components disproportionately. Overall, the non-elites take about 12% longer to complete the event than the elites.
For the women, the results are similar:
| Run Total | Station Total | Finish Time | |
|---|---|---|---|
| Elite | 33:15 | 28:54 | 62:09 |
| Non-Elite | 37:33 | 32:15 | 69:51 |
| Difference | +4:18 | +3:21 | +7:42 |
Again, the non-elites are 12% slower than the elites. Here, though, the non-elite women are disproportionately impacted by the runs relative to the stations.
Event-Level Analysis
To get a better sense for where the elites outperform non-elites we can visualize the event-level data graphically. In the graphics below, I plot the race events (runs, stations) in race order. For each event, the mean duration for the group is plotted as a point, and the standard deviation of the durations for the group is depicted as a vertical bar passing through this mean point. A taller bar means there is more variability in the times for that particular event within the group, while a shorter one means that the times for that event across the group are relatively consistent.
For the men, the event-level race breakdown looks like:
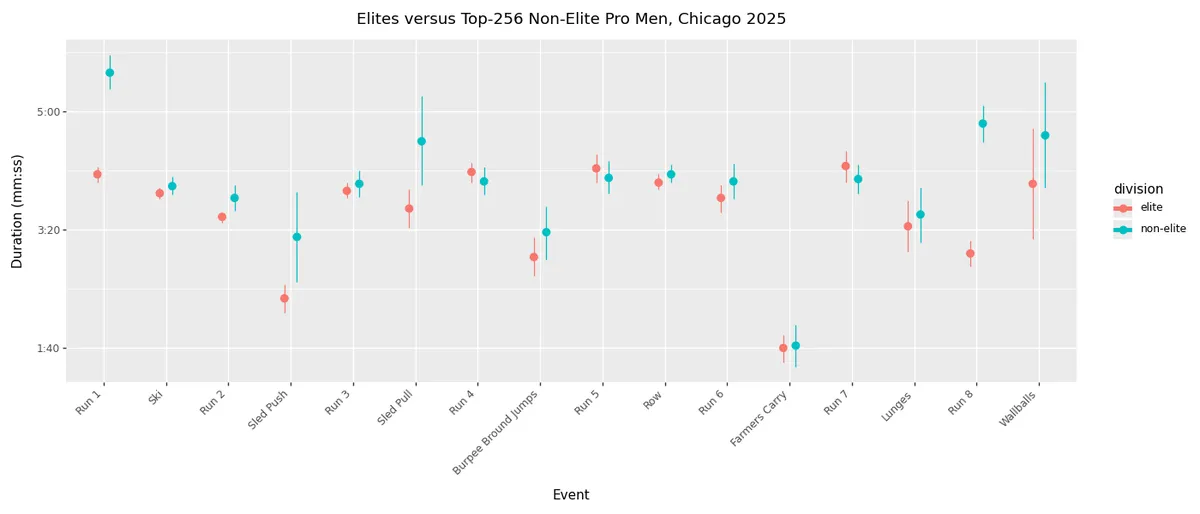
We can notice several interesting details in this visualization:
- There are only a few events on which the elites significantly outperform the non-elites, judging by the mean duration. These are the opening run, sled push and pull, the final run, and, to a lesser extent, the wallballs. For the remainder of the events, the mean times between the two groups are relatively close.
- The elites and the non-elites demonstrate similar levels of variability in their times for several high-variability stations, including burpee broad jumps, lunges, and wallballs.
- The exceptions to this rule are sled push and sled pull. These display some variability for both groups, but the standard deviation of times for these two events is significantly higher for the non-elites than it is for the elites.
For the women, the results look like:
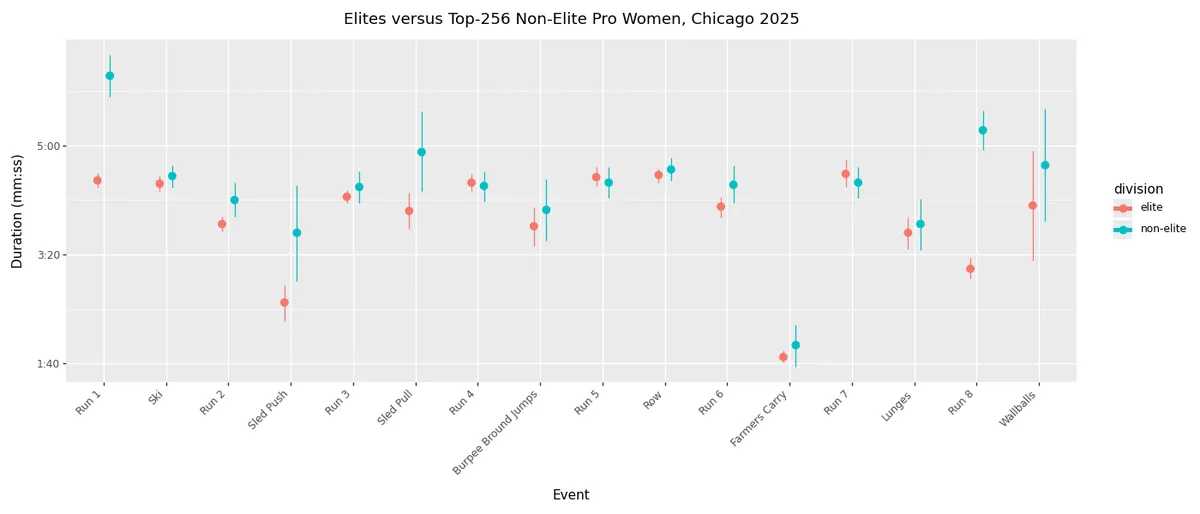
I think the salient points are:
- The first and last runs, sled push and pull, and wallballs remain the key differentiating factors between the elites and non-elites.
- Burpee broad jumps, lunges, and wallballs again show higher levels of variability across both groups.
- Sled push and pull again show much higher levels of variability for the non-elites than they do for the elites. Farmer's carry also joins this set, showing a much higher standard deviation in duration for the non-elites.
Across both men's and women's races, we can draw the following conclusions:
- Based on mean times, the elites are just a bit faster (
:05-:15seconds) on each event - Sled push, sled pull, and wallballs are the three stations during which the elite athletes capture the greatest time-savings relative to non-elites.
- Wallballs are a high-variability event for both elites and non-elites, likely as a result of its position as the final event in the race.
- Sled push and pull, on the other hand, show remarkable consistency amongst the elite field while being a high-variability event for the non-elites. This corroborates the difference-in-means result, suggesting that non-elites simply aren't as prepared to handle the sleds as the elites.
- Run times are similar for 6 out of the 8 run splits between the elite and non-elite fields, with only the first and last runs displaying significant differences in the mean times between the two groups 1.
Predicting Elite Performance
We can try to "automate" this process of determining which event performances correlate most-highly with elite athletes by framing this as a prediction problem: given event-level splits as input, can we predict whether the result was produced by an elite athlete? Which features (event splits) are most important in making this prediction?
To perform this analysis, I train a logistic regression model and examine the coefficients for each of the input features.
Thanks to sklearn's LogisticRegression classifier, training the model and evaluating its performance is straightforward:
from sklearn.linear_model import LogisticRegression

# fit the model
clf = LogisticRegression(random_state=RANDOM_STATE)
clf.fit(X_train, y_train)

# score accuracy on held-out examples
acc = clf.score(X_test, y_test)
print(f"accuracy = {acc:.2f}")
For both men and women, the model achieves 100% accuracy on the test set, always correctly predicting whether the input splits belong to an elite athlete or not.
We can examine the coefficients to explain how the model arrives at these correct predictions. The raw coefficient values correspond to changes (increases or decreases) in the logarithm of the odds for the "elite" outcome. We can exponentiate the coefficients to get the impact of the feature on the odds ratio directly.
Below are the features and their corresponding impact on log-odds for the model I built for the men's race. I limit the results in the table to those with an odds difference that exceeds 5%. The complete table is available in the appendix.
| Feature | e^Coefficient |
|---|---|
run_8 |
0.89 |
run_1 |
0.94 |
run_7 |
1.05 |
run_4 |
1.05 |
run_5 |
1.05 |
For the women, even fewer coefficients are significant to the model. The complete table is again available in the appendix.
| Feature | e^Coefficient |
|---|---|
run_8 |
0.90 |
run_1 |
0.94 |
run_7 |
1.05 |
For both men and women, I expected to see the stations with relatively-large differences in means between the two groups (e.g. sleds, wallballs) represented in the model's coefficients. Instead, we see the expected run splits (run_8 and run_1) while the stations are deemed insignificant from the perspective of prediction. I believe this is a result of the relatively-high variability in the splits for these stations. While the mean times are quite different, their predictive power is limited because they also exhibit a large standard deviation, particularly for the non-elite athletes.
Conclusion
So, based on race results, what are the key performance measures that distinguish elite Hyrox athletes from the top non-elites in the same weight category?
The results from the 2025 World Championships suggest that, as we might expect, the elites are a bit faster across the board relative to the non-elite athletes. Several stations do stand out, however, as large difference-makers, including sled push, sled pull - the elites move the sleds much faster on average, and do so more consistently than non-elites. Wallballs also make a big difference, with elites completing the station almost 50 seconds faster than non-elites, on average.
Appendix
We need to this difference with a grain of salt, however. Its possible that some of this effect is a result of my decision to handle the roxzone discrepancy by distributing it to the run splits.
The complete table of features and their coefficients for the men's race is provided below.
| Feature | Coefficient |
|---|---|
run_8 |
0.89 |
run_1 |
0.94 |
run_7 |
1.05 |
run_4 |
1.05 |
run_5 |
1.05 |
row |
1.03 |
ski |
1.03 |
run_3 |
1.03 |
sled_pull |
0.98 |
sled_push |
0.99 |
farmers_carry |
1.02 |
run_2 |
1.01 |
wallballs |
0.99 |
burpee_bround_jumps |
0.99 |
lunges |
1.01 |
run_6 |
1.01 |
- The complete table of features and their coefficients for the women's race is provided below.
| Feature | Coefficient |
|---|---|
run_8 |
0.90 |
run_1 |
0.94 |
run_7 |
1.05 |
run_5 |
1.04 |
run_4 |
1.04 |
row |
1.03 |
ski |
1.03 |
run_3 |
1.03 |
sled_pull |
0.99 |
sled_push |
0.99 |
lunges |
1.02 |
wallballs |
0.99 |
burpee_bround_jumps |
1.01 |
run_6 |
1.01 |
run_2 |
1.01 |
farmers_carry |
1.01 |